Mendix: How to debug javaaction with IntelliJ and VS Code
- Hank
- 14 Jul, 2024
Sometimes, you may want to debug the Java actions in Mendix project. In the Mendix Documentation, it only shows how to debug Java actions with Eclipse. But for those who are using IntelliJ or VS Code, how to do that?
In this post, I will show you how to debug Java actions in Mendix project with IntelliJ and VS Code.
Debug Java action with IntelliJ
- Open the Mendix project in Mendix Studio Pro
- Goto you App settings, double click your app configuration.
- In the
Servertab, input-agentlib:jdwp=transport=dt_socket,server=y,suspend=n,address=*:5005in theExtra JVM parametersfield. This will enable the remote debug mode for the Mendix project.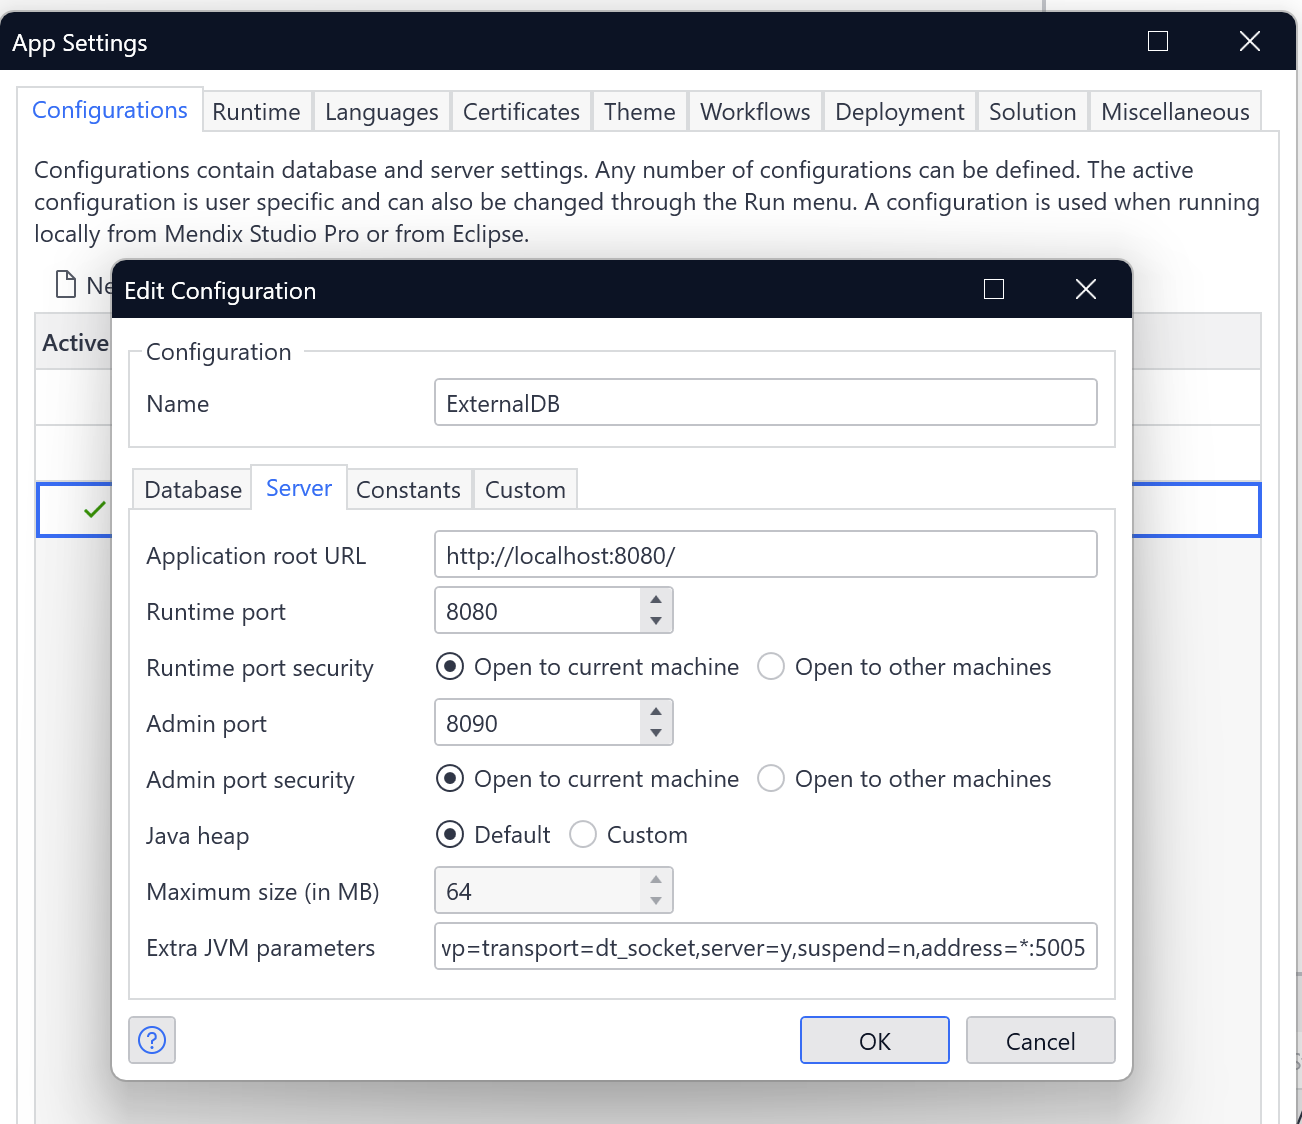
- Open the Mendix Project in IntelliJ
- Open the debug configuration, click the
+icon to add a new configuration, selectRemote JVM Debugin the popup window. - Make sure the parameters in
hostandportare the same as theaddressin the Mendix project settings. and alsoCommand line arguments for remote JVMshould be same as theExtra JVM parametersin the Mendix project settings.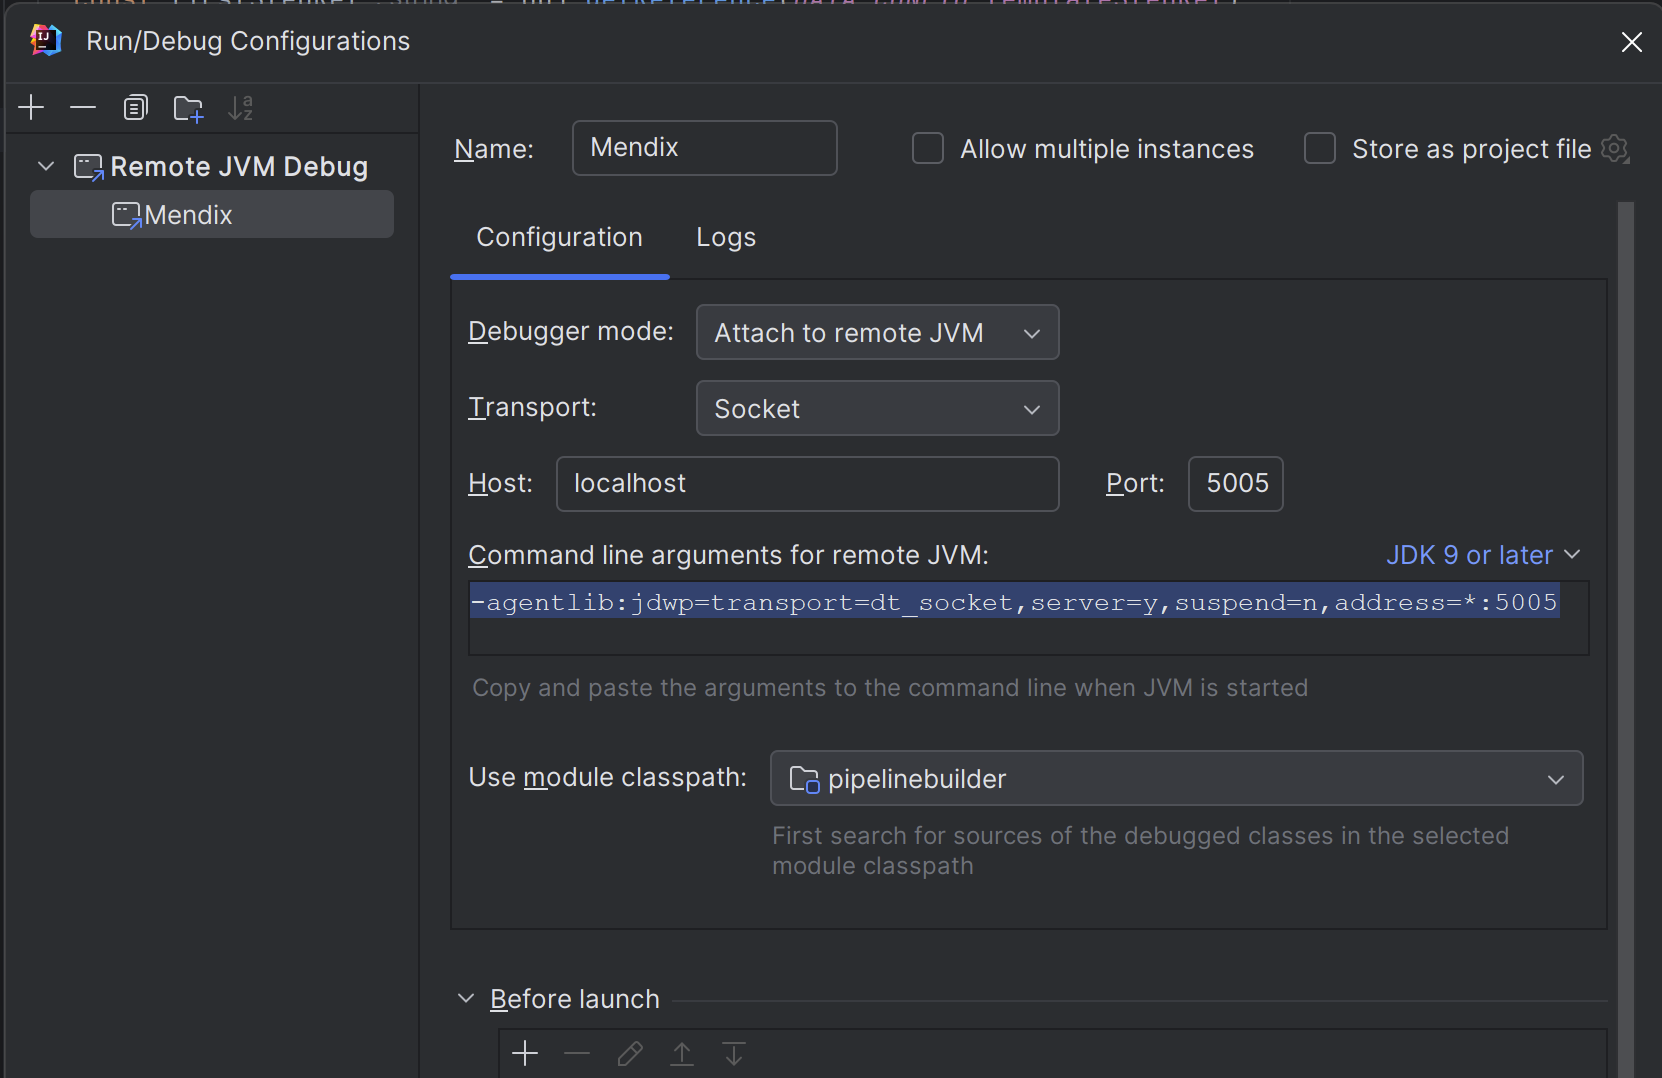
- Click
ApplyandOKto save the configuration. - In the Mendix Studio Pro, click the
Runbutton to start the project. - Now you can set breakpoints in the Java action code, and click the debug button to start the debug session.
Debug Java action with VS Code
- Keep the Mendix project settings as the same as the IntelliJ settings.
- Open the Mendix project in VS Code
- Install the
Java Extension Packin the VS Code - Open the debug panel in VS Code, click the
Add Configurationbutton, selectJava: Attach to Remote Programin the popup window. - Make sure the
hostandportare the same as theaddressin the Mendix project settings. and alsoCommand line arguments for remote JVMshould be same as theExtra JVM parametersin the Mendix project settings.{ "type": "java", "name": "Mendix Remote Debug", "request": "attach", "hostName": "localhost", "port": 5005 } - Click
ApplyandOKto save the configuration. - In the Mendix Studio Pro, click the
Runbutton to start the project. - Now you can set breakpoints in the Java action code, and click the debug button to start the debug session.